


.svg.png)

Energy organizations don't build "a digital twin" in the abstract — they build one of at least three distinct kinds, depending on what they're trying to optimize. Confuse the three and you end up modeling the wrong data, choosing the wrong platform, or building something your team can't act on. This guide compares the three main ways energy operations deploy digital twins today, so you can identify the right starting point before you invest.
At a glance: three approaches to energy digital twins
| Approach | Best for | Core data inputs | What it optimizes |
|---|---|---|---|
| Renewable & solar generation twins | Solar/wind asset owners forecasting output and planning maintenance | Weather data, panel/turbine sensor telemetry, historical generation curves | Generation forecasting, panel degradation tracking, maintenance scheduling |
| Smart grid & building energy twins | Utilities, smart city programs, and commercial building operators managing distributed load | Grid telemetry, building management system (BMS) data, IoT sensor networks, occupancy data | Load balancing, demand response, building-level energy efficiency |
| Industrial & facility operations twins | Manufacturers and large facility operators managing energy as a production input | SCADA/PLC data, equipment sensors, production schedules, utility billing data | Peak demand management, energy cost per unit of output, equipment-level consumption |

Renewable & solar generation twins
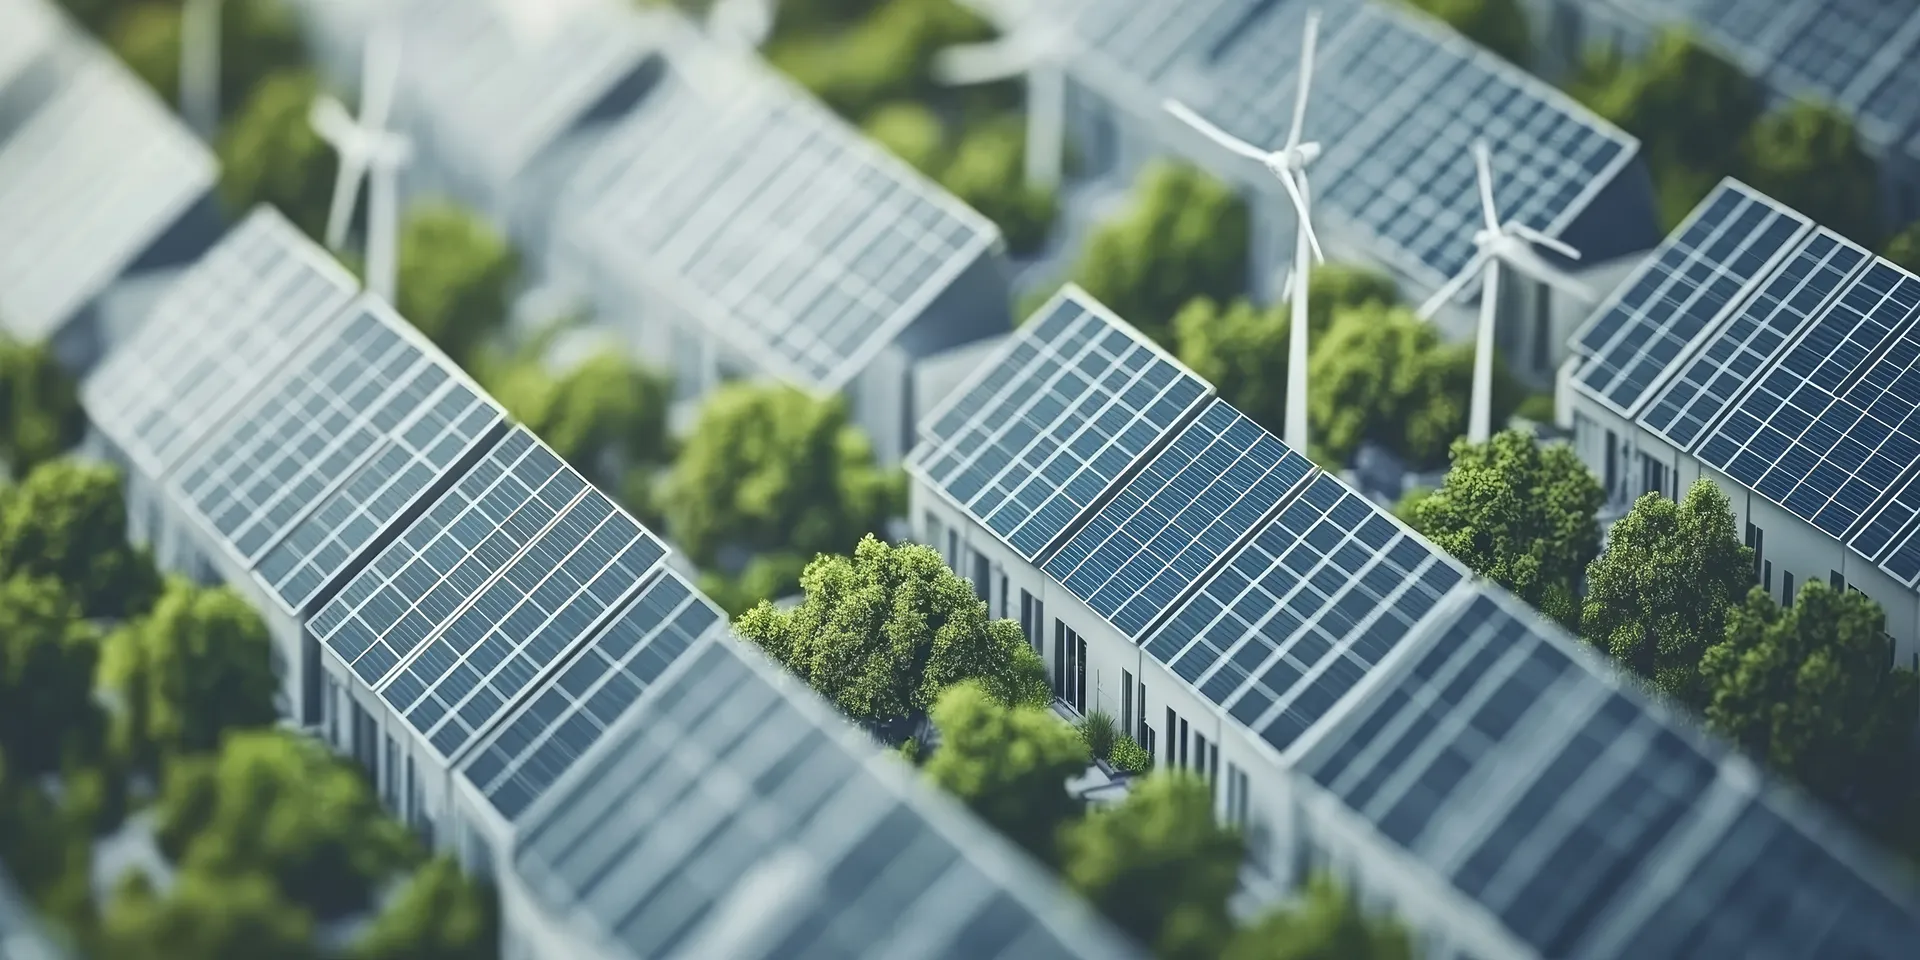
A generation twin is a live model of a solar array, wind farm, or mixed renewable asset, built from panel- or turbine-level sensor telemetry combined with weather forecasting data. It simulates expected output under current and forecast conditions, flags underperforming strings or turbines before a routine inspection would catch them, and tracks degradation curves over the asset's lifetime so maintenance can be scheduled proactively rather than reactively.
This approach fits utility-scale or commercial solar/wind portfolios where even a 1-2% forecasting error compounds into a meaningful revenue swing, and where technician time for physical inspection is expensive relative to the value of catching a fault early through the model. IBM's overview of digital twins for renewable energy covers how the approach extends across wind, solar, storage, and hydropower assets.
How a renewable generation twin comes together
The build typically starts with instrumentation you already have or can add cheaply: inverter-level or string-level monitoring on solar, SCADA data from turbine controllers on wind, plus a weather data feed (NOAA, Solcast, or a similar irradiance/wind-speed API). That telemetry streams into a time-series database (InfluxDB, TimescaleDB, or a cloud equivalent like AWS IoT SiteWise), where it's matched against a physics-based or ML-trained performance model of the asset — the "twin" itself. Dashboards (Grafana, Power BI, or a purpose-built platform like Uplight or Utopus Insights) sit on top for the operations team, and an alerting layer flags deviation between modeled and actual output beyond a set threshold.
Implementation is usually staged: instrument one representative asset or string first, validate the model against a season of real data, then roll the pipeline out fleet-wide. Trying to twin an entire portfolio before validating the model on one asset is the most common way these projects stall.
KPIs to track
- Forecast accuracy (modeled vs. actual output, typically measured as MAPE — mean absolute percentage error)
- Time from anomaly to detection (how long between a fault occurring and the twin flagging it)
- Degradation rate tracked per asset vs. manufacturer-rated degradation curve
- Avoided truck rolls / inspection hours from early fault detection
Common pitfalls
- Skipping model validation against a full seasonal cycle before trusting its forecasts
- Treating weather data as "good enough" from a coarse regional feed instead of asset-specific irradiance/wind data
- No clear owner for acting on alerts — the twin flags a fault but nobody's tasked with responding to it
- Building the dashboard before the data pipeline is reliable, so the first impression of the tool is bad data
Smart grid & building energy twins
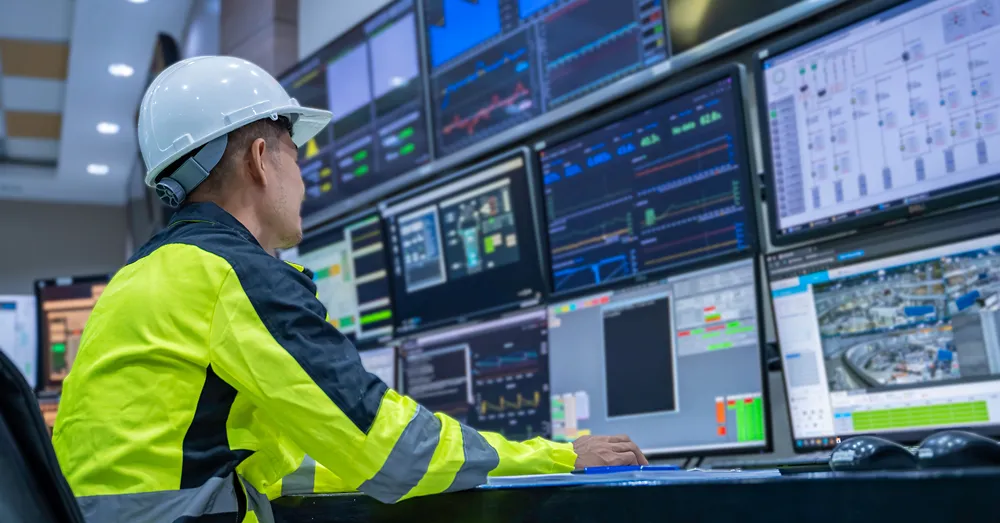
A grid or building twin models energy flow across a distribution network or a building portfolio rather than a single generation asset. It combines grid telemetry or building management system (BMS) data with IoT sensor networks and, often, occupancy or usage data, to simulate how load moves through the system in real time.
The output isn't a generation forecast — it's a live view of where load is concentrated, where demand response programs can shift consumption without disrupting operations, and where a building or feeder is wasting energy relative to its modeled baseline. This approach fits utilities managing distributed energy resources, smart city programs coordinating multiple buildings or districts, and commercial real estate operators who need to cut energy spend across a portfolio rather than a single asset. Building-sector energy demand and efficiency trends are tracked by the IEA's buildings program, a useful benchmark when scoping a grid or building twin.
How a grid or building twin comes together
This build leans on whatever building management system (BMS) or SCADA platform you already have — Siemens Desigo, Honeywell, Johnson Controls Metasys, or a grid-side DERMS/ADMS platform — as the primary data source, supplemented with IoT sensors (submeters, occupancy sensors, HVAC telemetry) wherever the BMS doesn't already cover it. That data feeds a simulation layer (often built on tools like EnergyPlus for building physics, or a vendor platform like Siemens Xcelerator or Schneider EcoStruxure) that models how load will respond to a given change before it's made.
Most organizations start with a single high-value building or feeder as a pilot, prove out the demand-response or load-balancing use case there, then extend the model to the rest of the portfolio using the same sensor and integration pattern.
KPIs to track
- Peak demand reduction (kW shaved during demand response events)
- Modeled vs. actual load variance (how closely the twin's predictions track reality)
- Energy cost per square foot / per building, before vs. after
- Response time to a demand response signal (from utility call to load shed)
Common pitfalls
- Integrating only the BMS and skipping submetering, so the twin can't see load at the equipment level where waste usually hides
- No baseline period established before changes are made, so "savings" can't be proven
- Modeling a single building in isolation when the real opportunity is portfolio-level load shifting
- Underestimating the IT/OT integration work between the BMS vendor and the twin platform
Industrial & facility operations twins
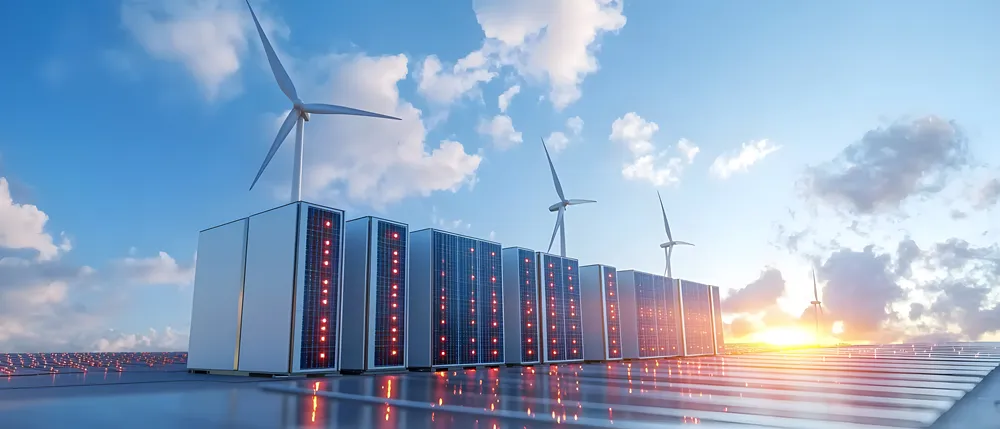
An industrial or facility operations twin treats energy as an input to production, not a standalone system. It pulls from SCADA/PLC data, equipment-level sensors, production schedules, and utility billing data to model energy consumption per unit of output, identify which equipment or shifts drive peak demand charges, and simulate how a production schedule change would affect the energy bill before it's implemented.
This is the right approach for manufacturers and large facility operators where energy is a top-five line-item cost and where production scheduling has real flexibility — shifting an energy-intensive process by a few hours can avoid peak demand charges without touching output targets. McKinsey's research on factory digital twins documents how manufacturers use real-time factory models to support exactly this kind of scheduling decision.
How an industrial or facility operations twin comes together
The data backbone here is usually existing SCADA/PLC infrastructure (Rockwell, Siemens, Schneider) combined with a historian (OSIsoft PI, or an open-source equivalent) that already logs equipment run-states and energy draw. That gets layered with production scheduling data from the MES or ERP system, and utility interval/billing data (often the hardest piece to get in a usable format). A simulation or digital twin platform — Siemens Plant Simulation, AVEVA, or a custom model — sits on top to tie energy consumption to specific production runs and simulate the cost impact of a schedule change before it happens.
The fastest path to value is usually starting with the single largest energy-consuming process line rather than trying to model the whole facility at once — it's where a scheduling change has the clearest payback.
KPIs to track
- Energy cost per unit of output (the core metric tying energy to production)
- Peak demand charge avoided per month
- Number of scheduling changes made based on twin recommendations vs. gut-feel scheduling
- Model accuracy: predicted vs. actual utility bill
Common pitfalls
- Utility billing data arriving too late or too coarse (monthly instead of interval) to validate the model quickly
- Energy and production data living in separate systems with no common timestamp/ID to join them
- Modeling energy in isolation from the production constraints that actually drive scheduling decisions
- No feedback loop from actual utility bills back into the model to keep it accurate over time
Which approach fits your operation?
- You own or operate solar/wind generation assets and need to forecast output or plan panel/turbine maintenance → start with a renewable generation twin.
- You manage a building portfolio, campus, or distribution network and need to balance load or cut energy waste across sites → start with a smart grid/building twin.
- You run a manufacturing plant or industrial facility where energy is a major cost input to production → start with an industrial/facility operations twin.
- Not sure which applies? Many operations blend two of these — a facility with its own solar array and a heavy production load benefits from a generation twin and an operations twin working together, feeding a shared dashboard.
Frequently asked questions
How much does a digital twin for energy management cost to implement?
Cost scales with data readiness more than with twin complexity — a facility with existing SCADA, BMS, or inverter-level monitoring can often get a pilot running in weeks for a fraction of the cost of one that needs new sensors installed first. Renewable generation twins and grid/building twins are typically the fastest and cheapest to pilot; industrial operations twins take longer because production and energy data usually live in separate systems that need to be joined first.
Can I start with a pilot instead of a full rollout?
Yes, and it's the recommended approach across all three types — validate the model against one asset, building, or process line for a full seasonal or operational cycle before extending it fleet-wide. A pilot that fails cheaply and fast is far less costly than a fleet-wide rollout built on an unvalidated model.
Do I need new sensors, or can I use what I already have?
Most organizations already have more usable data than they realize — inverter/SCADA telemetry, BMS data, and utility interval data can usually get a first version of the twin running. New sensors (submetering, additional weather stations) typically get added later, once the pilot proves the use case and shows where the existing data has blind spots.
How is this different from a standard energy dashboard or BI report?
A dashboard shows what already happened. A digital twin simulates what would happen under a change you haven't made yet — a different schedule, a demand response event, a forecast weather pattern — before you commit to it. That's the difference between reporting and decision support.
Ready to scope a digital twin for your energy operations?
Talk to VisioneerIT's digital twin team about mapping your assets and data sources to the right approach.

%402x.svg)
%402x.svg)

